samiul@portfolio:~/projects/historical-earth$ cat README.md
08 Historical Earth
A 3D globe where the year is a slider: borders, leaders and events from 1600 to today.
samiul@portfolio:~/projects/historical-earth$ cat problem.txt
Historical maps are usually static images or encyclopedia infoboxes. The goal was an explorable globe where you scrub through time and watch borders move.
samiul@portfolio:~/projects/historical-earth$ cat build.log
A SvelteKit app on a MapLibre 3D globe with satellite imagery. Borders run from 1600 to the present; the timeline steps a year at a time and gets finer around wars and crises so 1914 isn't one tick. Click a country for its flag, government, leader and a summary; curated cities, battles and milestones sit on the map as pins. Behind it is a real data pipeline of TypeScript scripts that build, validate and overlap-check the border snapshots, and the client loads GeoJSON plus a SQLite file in the browser.
samiul@portfolio:~/projects/historical-earth$ xdg-open screenshot.jpg
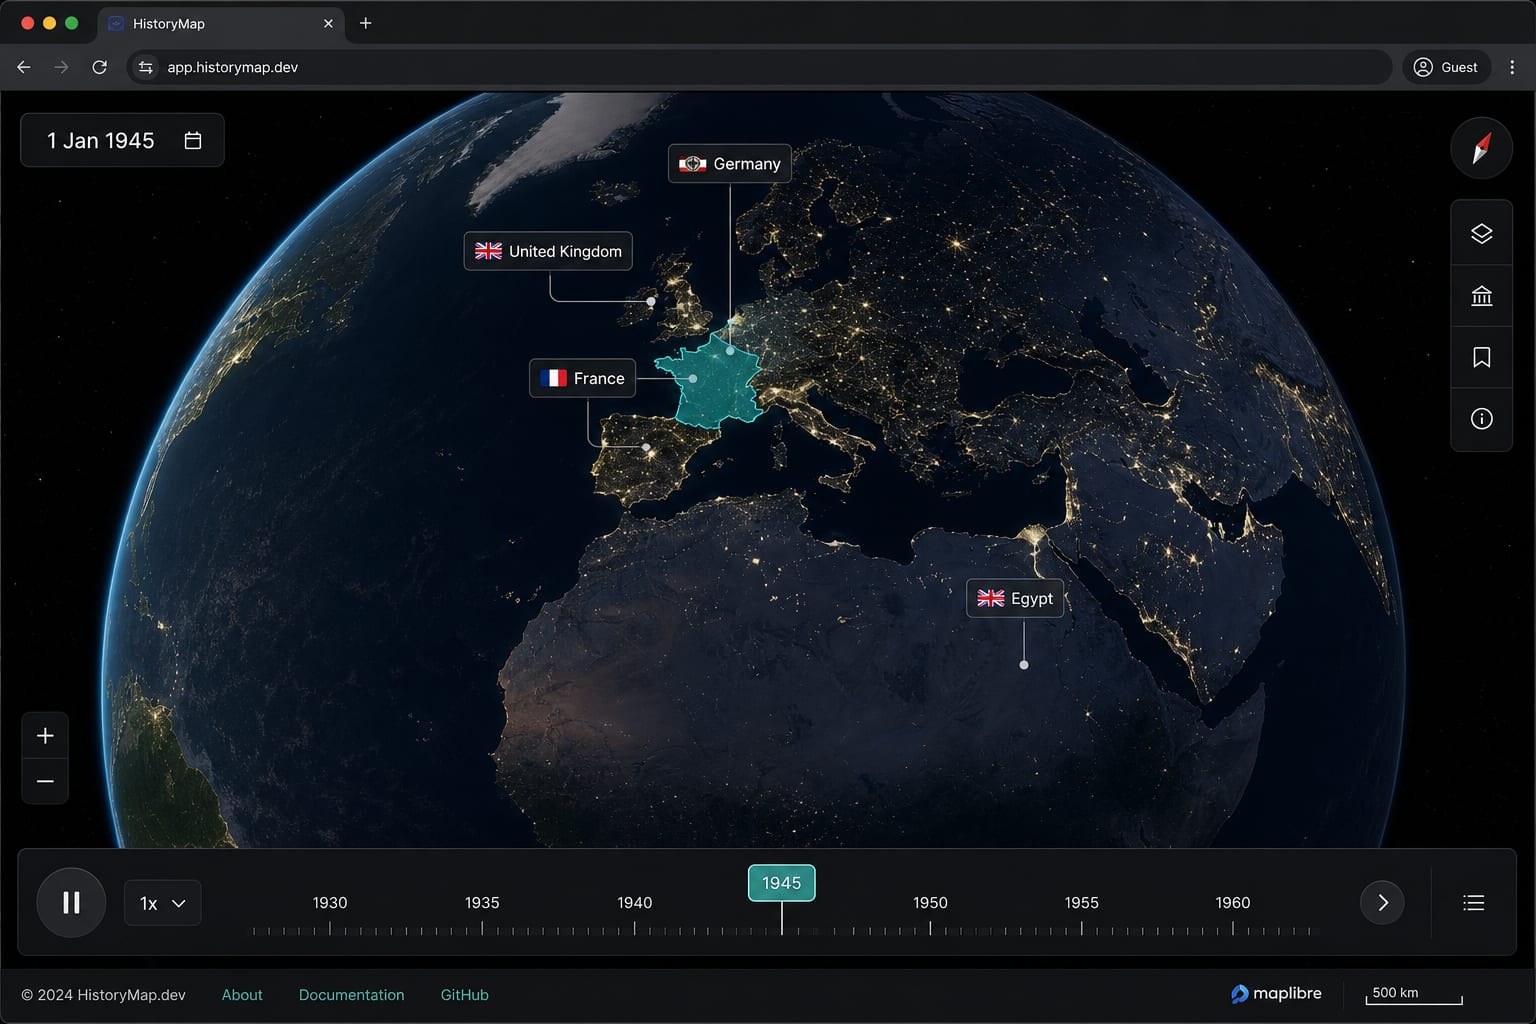
samiul@portfolio:~/projects/historical-earth$ cat highlights.txt
- MapLibre 3D globe with satellite imagery
- Borders from 1600 through today
- Timeline that tightens around wars and crises
- Build/validate data pipeline for border snapshots
- GeoJSON + SQLite in the browser
samiul@portfolio:~/projects/historical-earth$ cat stack.toml
# historical-earth
lang = "typescript"
app = "sveltekit (static)"
map = "maplibre gl globe"
time = "1600 → now, adaptive steps"
data = "geojson + sqlite (sql.js)"
stack = ["SvelteKit", "TypeScript", "MapLibre", "SQLite"]
samiul@portfolio:~/projects/historical-earth$ git remote -v